Entrepreneurs generally thrive on problem solving, and the most successful startups are those that address a specific consumer need. Therefore, it’s no surprise that a tool designed to aid in problem resolution would be particularly valuable to entrepreneurs. This is where the fishbone diagram comes into play.
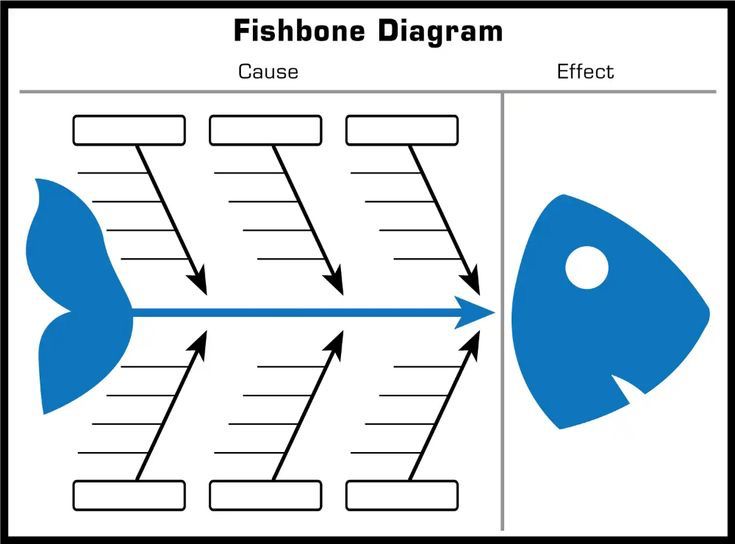
Also known as cause-and-effect diagrams, fish disease, fish snap method, or Ishikawa diagrams, fishbone diagrams help identify the root causes of problems. They are commonly used in problem solving to analyze the various factors contributing to an issue.
The diagram was first introduced in 1965 by Japanese organizational theorist Kaoru Ishikawa as a process analysis tool. Its primary purpose is to document problems and explore potential causes. Although the diagram might appear complex, it is actually quite user-friendly.
What is a Fishbone Diagram?
This is a tool used during the analysis phase of a project to facilitate problem-solving. It helps with brainstorming and identifying potential root causes that can be addressed.
A typical fishbone diagram may feature categories such as:
– Potential causes
– Associated causes
– Contributing factors
Why Use a Fishbone Diagram?
This diagram helps users uncover the relationships between various potential causes of issues, such as problems with product design, process functionality, or other areas. It enables brainstorming and identifies areas that may require deeper investigation. Additionally, it reveals multiple potential sources of a problem, rather than just a single primary cause.
Here are some key reasons to use a fishbone diagram:
1. Facilitates Brainstorming
Fishbone diagrams support brainstorming sessions aimed at identifying causes of issues or opportunities for improvement. The process often starts with generating ideas about potential causes within the diagram’s main structure.
2. Openly Displays Relationships
Fishbone diagrams are valuable tools for startups as they not only identify problems but also illustrate the relationships between different factors contributing to the same issue. This visual representation helps clarify how various elements are interconnected.
3. Encourages Problem-Solving
Using a fishbone diagram promotes structured problem-solving by providing a graphical way to organize thoughts. Many experts believe it helps people think more clearly about an issue, often used in quality management and continuous improvement efforts.
4. Helps Maintain Focus
When initially creating a fishbone diagram, it’s easy to generate a long list of potential causes. Writing down these possibilities can quickly become overwhelming. To stay focused, techniques can be applied to narrow down the list while still capturing enough ideas for further analysis.
How to Use a Fishbone Diagram
Since its development by Ishikawa in 1965, fishbone diagrams have been widely used in startups and continue to be valuable tools across various industries, from manufacturing to healthcare.
To use a fishbone diagram effectively:
– Define the “fish”: Identify the main problem or issue that the diagram will address.
– Identify the “bones”: Determine the factors that could be contributing to the problem.
– Branch out from each bone: Add sub-branches to each factor, labeling them accordingly to represent specific causes or related issues.
How to Create a Fishbone Diagram
Must Read:7 Techniques Startups Can Use to Strengthen Communication

To start, determine the focus of your diagram, which could involve understanding the key elements or participants in the process from beginning to end. Here’s how to construct a fishbone diagram step by step:
1. Write the Problem Statement: Begin by placing the issue you want to solve at the center of the diagram.
2. Identify Potential Causes: List the possible causes of the problem, branching out from the main line.
3. Break Down Each Cause: For each cause, add sub-causes, breaking them down further until you reach manageable, solvable factors.
A fishbone diagram consists of five main components:
– The Problem Title
– A Problem Description or statement
– A Causes List, typically divided into 7 main categories
– A Sub-causes List, with around 8 secondary categories
– An Effects/Consequences List, outlining about 7 secondary factors
Tips for Creating a Fishbone Diagram
When building a fishbone diagram, consider these helpful tips:
1. Involve the Whole Team: Encourage everyone to participate in the brainstorming session.
2. Keep the Focus on Causes: Use the diagram to maintain the team’s attention on identifying and analyzing the causes.
3. Apply the “Why” Technique: Ask “why” repeatedly to get to the root of each reason and understand its rationale.
4. Double-Check Cause Categories: Make sure that the categories of causes are accurate and relevant.
5. Use Visual Aids: Draw the diagram on a dry erase board or flip chart for easy adjustments.
6. Use Digital Tools: Tools like Edraw can help you create a fishbone diagram with fewer errors.
Fishbone diagrams can be a vital resource for startups to identify and diagnose problems, find root causes, brainstorm solutions, and stay focused on the main issue. Consider using this approach when addressing challenges in your startup.
Conclusion
A Fishbone Diagram, also known as a Cause-and-Effect Diagram, is a powerful tool for startups looking to diagnose and solve problems effectively. It helps break down complex issues into manageable causes, making it easier to identify the root of a problem and take corrective actions. By visually mapping out potential factors contributing to a problem, startups can engage in structured brainstorming and collaborative analysis, leading to more comprehensive and innovative solutions. Using a Fishbone Diagram not only enhances problem-solving efficiency but also fosters a culture of continuous improvement, enabling startups to navigate challenges and grow sustainably.

